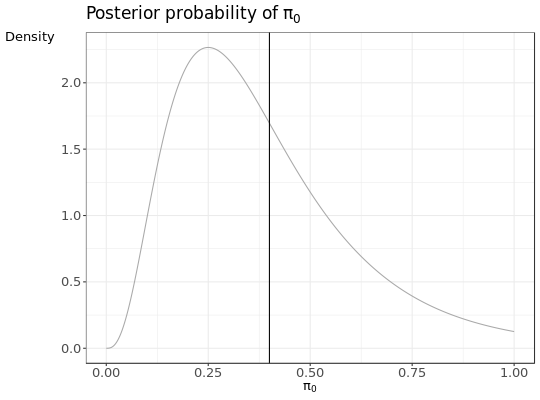
Creates density plot of the pi0 distribution.
There is also a vertical line plotted that represent a conservative \(\pi_0\) estimate. This estimate is used in our more stable FDR estimation in the subset PSMs of interest.
pi0plot(n_targets, n_decoys, conservative_pi0 = TRUE)
Arguments
| n_targets | vector of observed target PSMs. |
|---|---|
| n_decoys | vector of observed decoy PSMs. |
| conservative_pi0 | logical; If TRUE (default), adds horizontal line indicating the conservative \(\pi_0\) estimate. |
Value
ggplot object.
Examples
## Visualize the pi0 distribution when observing 10 targets and 3 decoys
set.seed(10)
pi0plot(10,3)