Sample scores for a random dataset
The scores are sampled from a two-component mixture distribution of Gaussians.
sample_dataset(H1_n = 160, H0_n = 40, decoy_n = H0_n,
  decoy_large_n = 2000, H0_mean = 2.75, H1_mean = 3.31, H0_sd = 0.13,
  H1_sd = 0.28, decoy_mean = H0_mean, decoy_sd = H0_sd,
  decoy_large_mean = H0_mean, decoy_large_sd = H0_sd)
Arguments
| H1_n | number of correct subset target PSMs. |
|---|---|
| H0_n | number of incorrect subset target PSMs. |
| decoy_n | number of subset decoy PSMs. |
| decoy_large_n | number of non subset decoy PSMs. |
| H0_mean | mean of the incorrect subset target PSM distribution. |
| H1_mean | mean of the correct subset target PSM distribution. |
| H0_sd | sd of the incorrect subset target PSM distribution. |
| H1_sd | sd of the correct subset target PSM distribution. |
| decoy_mean | mean of the subset decoy PSM distribution. |
| decoy_sd | sd of the subset decoy PSM distribution. |
| decoy_large_mean | mean of the non subset decoy PSM distribution. |
| decoy_large_sd | sd of the non subset decoy PSM distribution. |
Value
dataframe with 4 columns:
- score
score assigned to the peptide to spectrum match (PSM).
- decoy
TRUE if decoy PSM, FALSE otherwise.
- H0
TRUE if incorrect target PSM, FALSE otherwise.
- subset
TRUE if PSM belongs to the subset in interest, FALSE or otherwise.
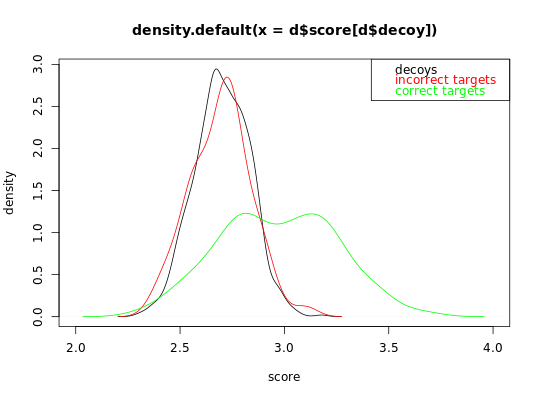
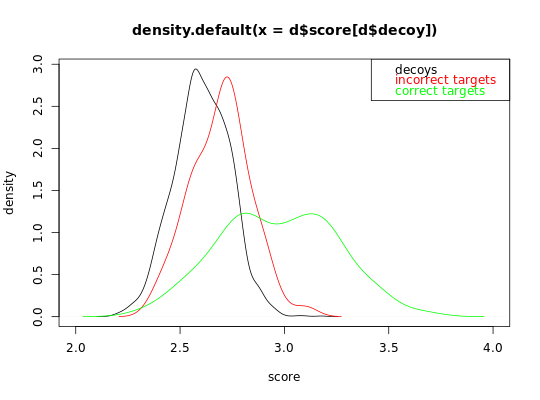
Examples
## Simulate a dataset with 140 correct target subset PSMs, 60 incorrect target subset PSMS,
##60 decoy subset PSMs and 2000 additional decoy PSMs.
## In this first example, incorrect subset target and decoy PSMs have a similar distribution
set.seed(10)
d = sample_dataset(H1_n = 140,H0_n = 60, decoy_n = 60 ,decoy_large_n = 2000,
                   H0_mean = 2.7, H1_mean = 3, decoy_mean = 2.7, decoy_large_mean = 2.7)
# visualize the decoy distribution and the correct and incorrect target distribution
plot(density(d$score[d$decoy]), xlim = c(2,4), xlab = 'score', ylab = 'density')lines(density(d$score[!d$decoy & d$H0]), col = 'red')lines(density(d$score[!d$decoy & !d$H0]), col = 'green')legend('topright', c('decoys', 'incorrect targets', 'correct targets'),
       text.col = c('black', 'red', 'green'))## In this first example, incorrect subset target and decoy PSMs have not a similar distribution
## because the additional set of decoy PSMs are not representative for the incorrect subset PSMs.
set.seed(10)
d = sample_dataset(H1_n = 140,H0_n = 60, decoy_n = 60 ,decoy_large_n = 2000,
                   H0_mean = 2.7, H1_mean = 3, decoy_mean = 2.7, decoy_large_mean = 2.6)
# visualize the decoy distribution and the correct and incorrect target distribution
plot(density(d$score[d$decoy]), xlim = c(2,4), xlab = 'score', ylab = 'density')lines(density(d$score[!d$decoy & d$H0]), col = 'red')lines(density(d$score[!d$decoy & !d$H0]), col = 'green')legend('topright', c('decoys', 'incorrect targets', 'correct targets'),
       text.col = c('black', 'red', 'green'))