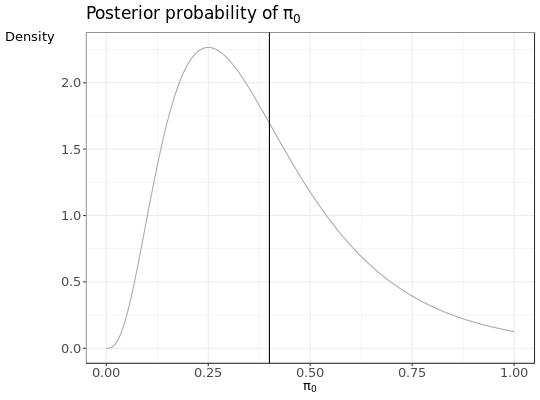
Density function for the \(\pi_0\) distribution.
Density function for the \(\pi_0\) distribution.
dpi0(pi0, n_targets, n_decoys)
Arguments
| pi0 | vector of \(\pi_0\) quantiles. |
|---|---|
| n_targets | vector of observed target PSMs. |
| n_decoys | vector of observed decoy PSMs. |
Value
vector of densities. The length is the maximum length of the numerical arguments. Returns 'NaN' for 'pi0 < 0' and 'pi > 1'.
Examples
## density at pi0 = .5 when observing 10 targets and 3 decoys dpi0(.5, 10, 3)#> [1] 1.176727## visualize the pi0 distribution when observing 10 targets and 3 decoys grid = seq(0,1,.01) dens = dpi0(grid,10 , 3) plot(dens, xlab = 'pi0', ylab = 'density')