Plot diagnostic plots to evaluate assumptions from the search all, search subset strategy.
Four diagnostic plots are created:
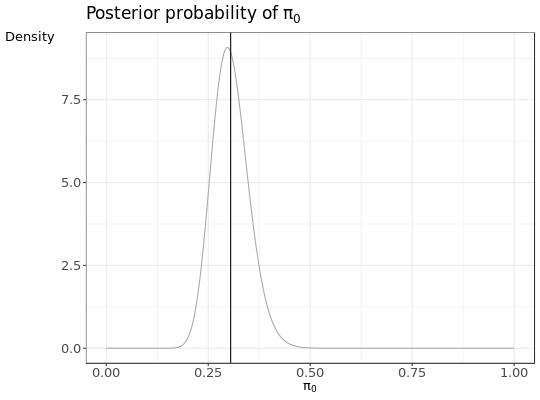
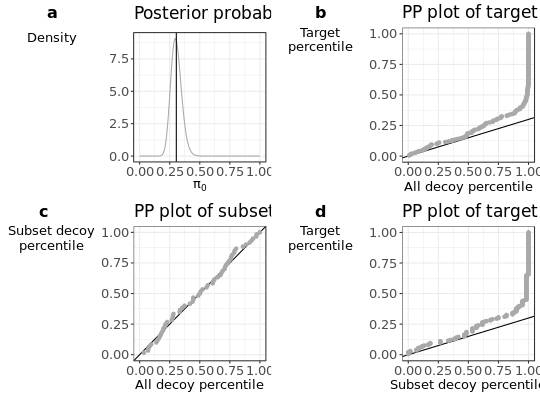
- a
pi0plot according the number of subset target and decoy PSMs.
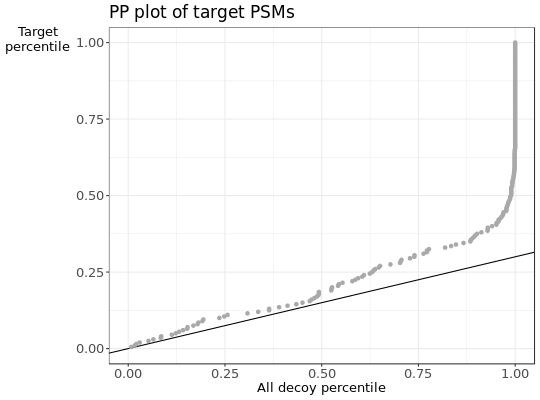
- b
PPplot of the decoy distribution against the subset target distribution.
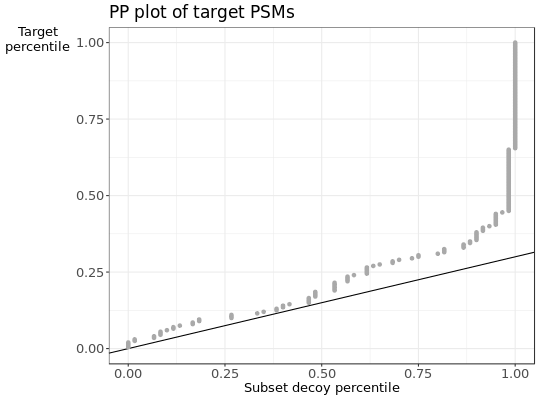
- c
PPplot of the decoy distribution against the subset decoy distribution.
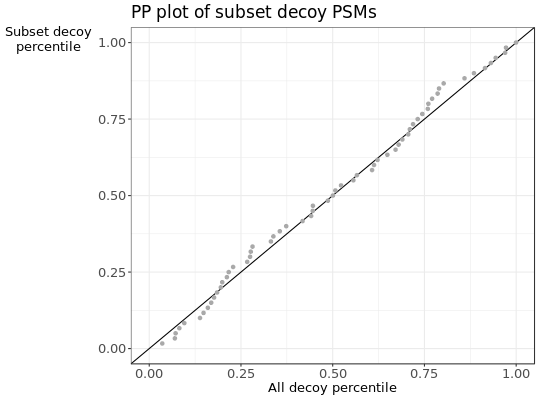
- d
PPplot of the subset decoy distribution against the subset target distribution.
plot_diag(df, score_higher = TRUE)
Arguments
| df | dataframe with at least 3 columns:
|
|---|---|
| score_higher | TRUE if a higher score means a better PSM. Additional columns are allowed but ignored. Target and decoy PSMs are assumbed to be from a competitive target decoy database search. |
Value
ggplot object.
Examples
## Simulate a dataset with 140 correct target subset PSMs, 60 incorrect target subset PSMS,
## 60 decoy subset PSMs and 2000 additional decoy PSMs.
set.seed(10)
d = sample_dataset(H1_n = 140,H0_n = 60, decoy_n = 60 ,decoy_large_n = 2000,
                   H0_mean = 2.7, H1_mean = 3.2, decoy_mean = 2.7, decoy_large_mean = 2.7)
##pi_0 can be estimated with the target-decoy aproach

plot_diag(d)#> $pi0plot#>
#> $decoyall_targetsubset#>
#> $decoyall_decoy_subset#>
#> $decoysubset_target_subset#>
#> $all#>