JSparklines
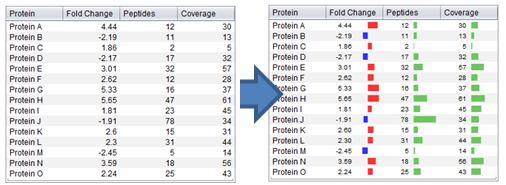
JSparklines makes it straightforward to visualize numbers in Java tables by the use of sparklines. All that is needed is a couple of lines of code.
The charts are created using JFreeChart and added to the table columns using custom TableCellRenderers.
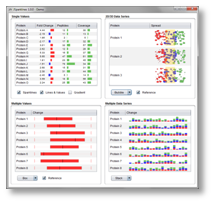
Supports more than 30 types of charts/renderers, including bar chart, line charts, stacked bar charts, bar charts with error bars, pie charts, scatter plots, interval charts, area charts, heat maps and box plots.
If you like JSparklines you may also want to check out JSparklines Factory.
JSparklines Publication:
- Barsnes et al: Proteomics. 2014. (doi: 10.1002/pmic.201400356).
- If you use JSparklines as part of a publication, please include this reference.
 |
v1.1.2 - All platforms | ReleaseNotes | JavaDoc |
How to use JSparklines
See the How to use JSparklines wiki page for code examples. JSparklines is also available as a Maven dependency.
If you have questions or would like to contribute to the JSparklines project, please contact the developers.
Examples
 |
 |
(Click on a figure to see the full size version)
Projects using JSparklines
Are you using JSparklines and would like your project listed here? Contact the developers of JSparklines.